Docs Data
Heatmaps
The market map, where positions liquidate, and where orders rest: three heatmaps, free for every market.
Three heatmaps, each with its own page under Data and free for every market.
The market map
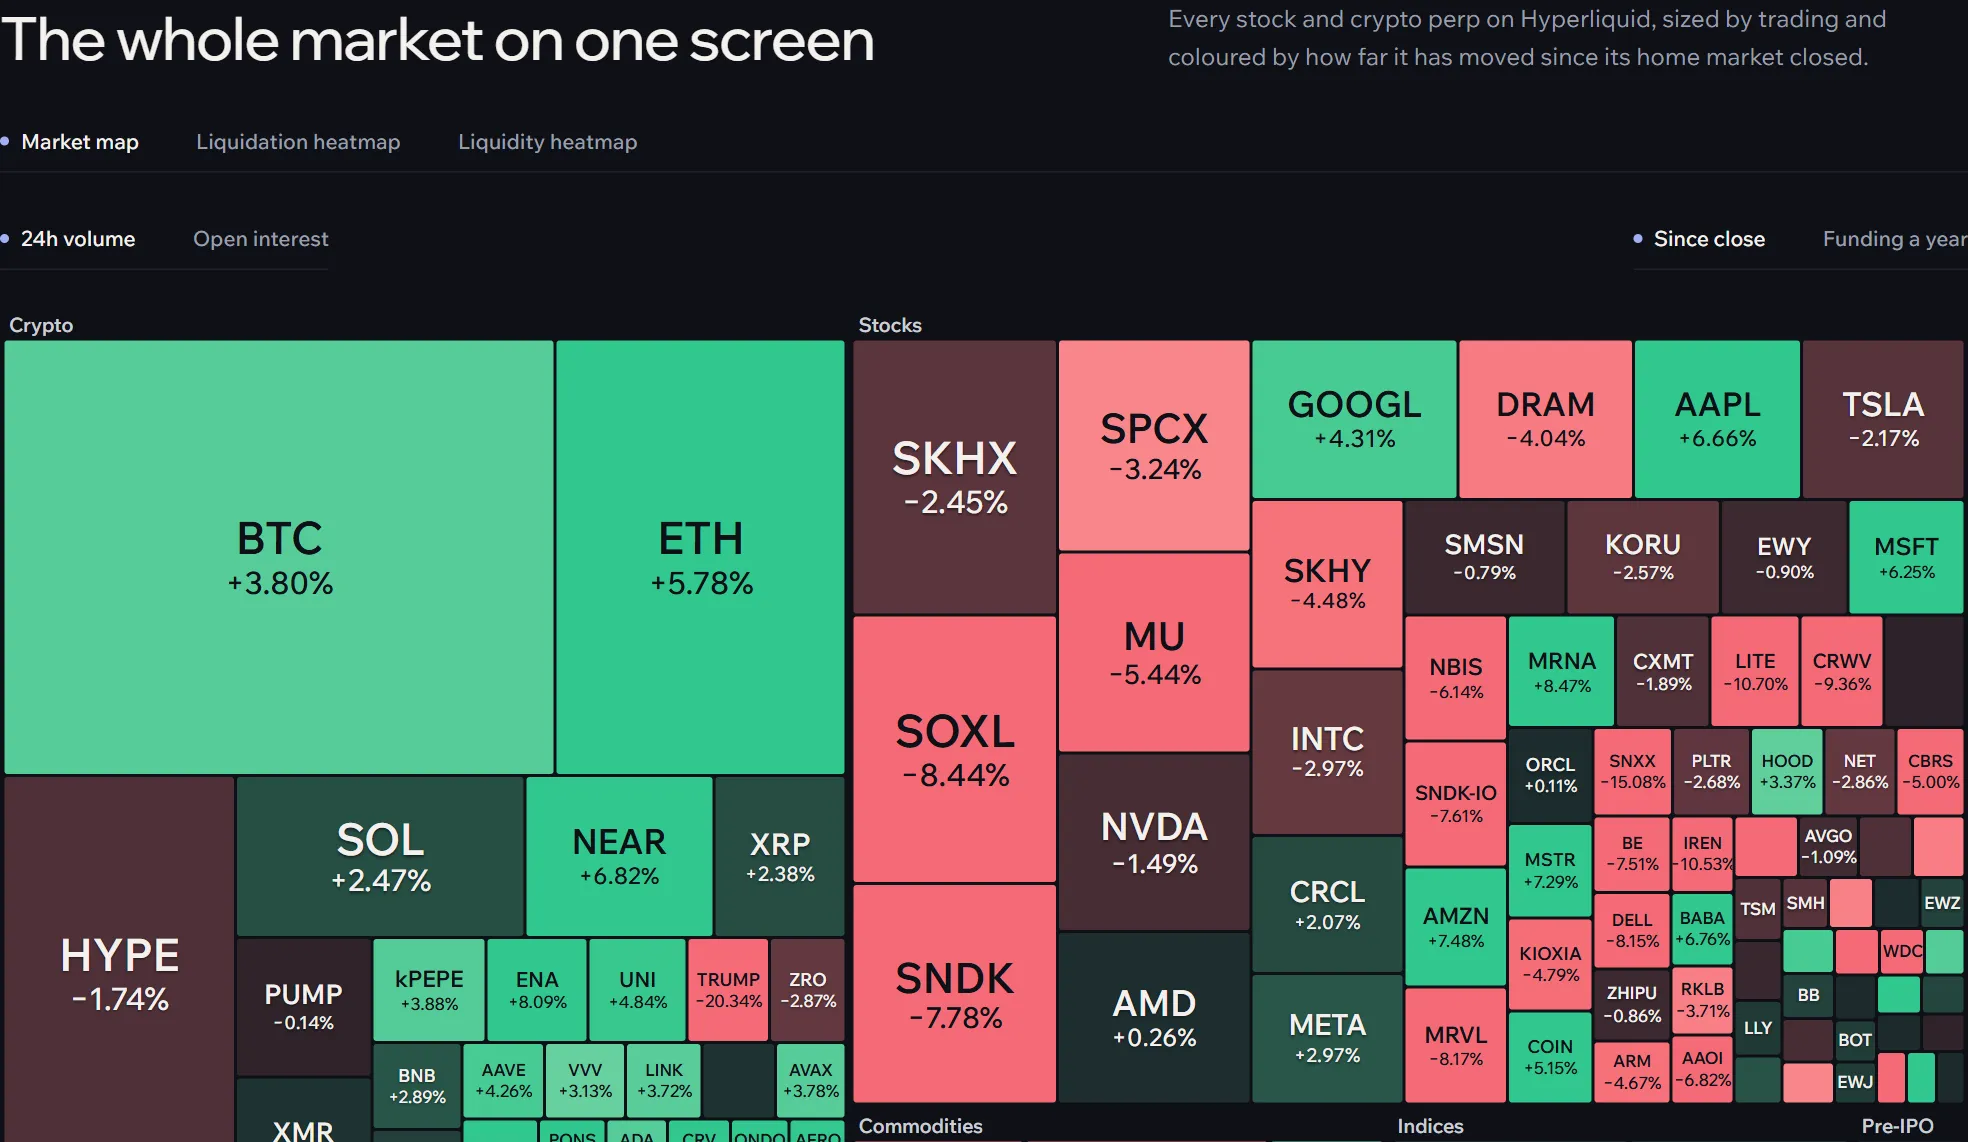
Every market as a tile, grouped by kind. Size by 24-hour volume or open interest; Colour by the move since the close (24 hours for crypto) or by funding. The biggest markets take the most room, and the colour shows at a glance where the night went. Click a tile to open its terminal; on a phone a small tile opens a card first.
The liquidation heatmap
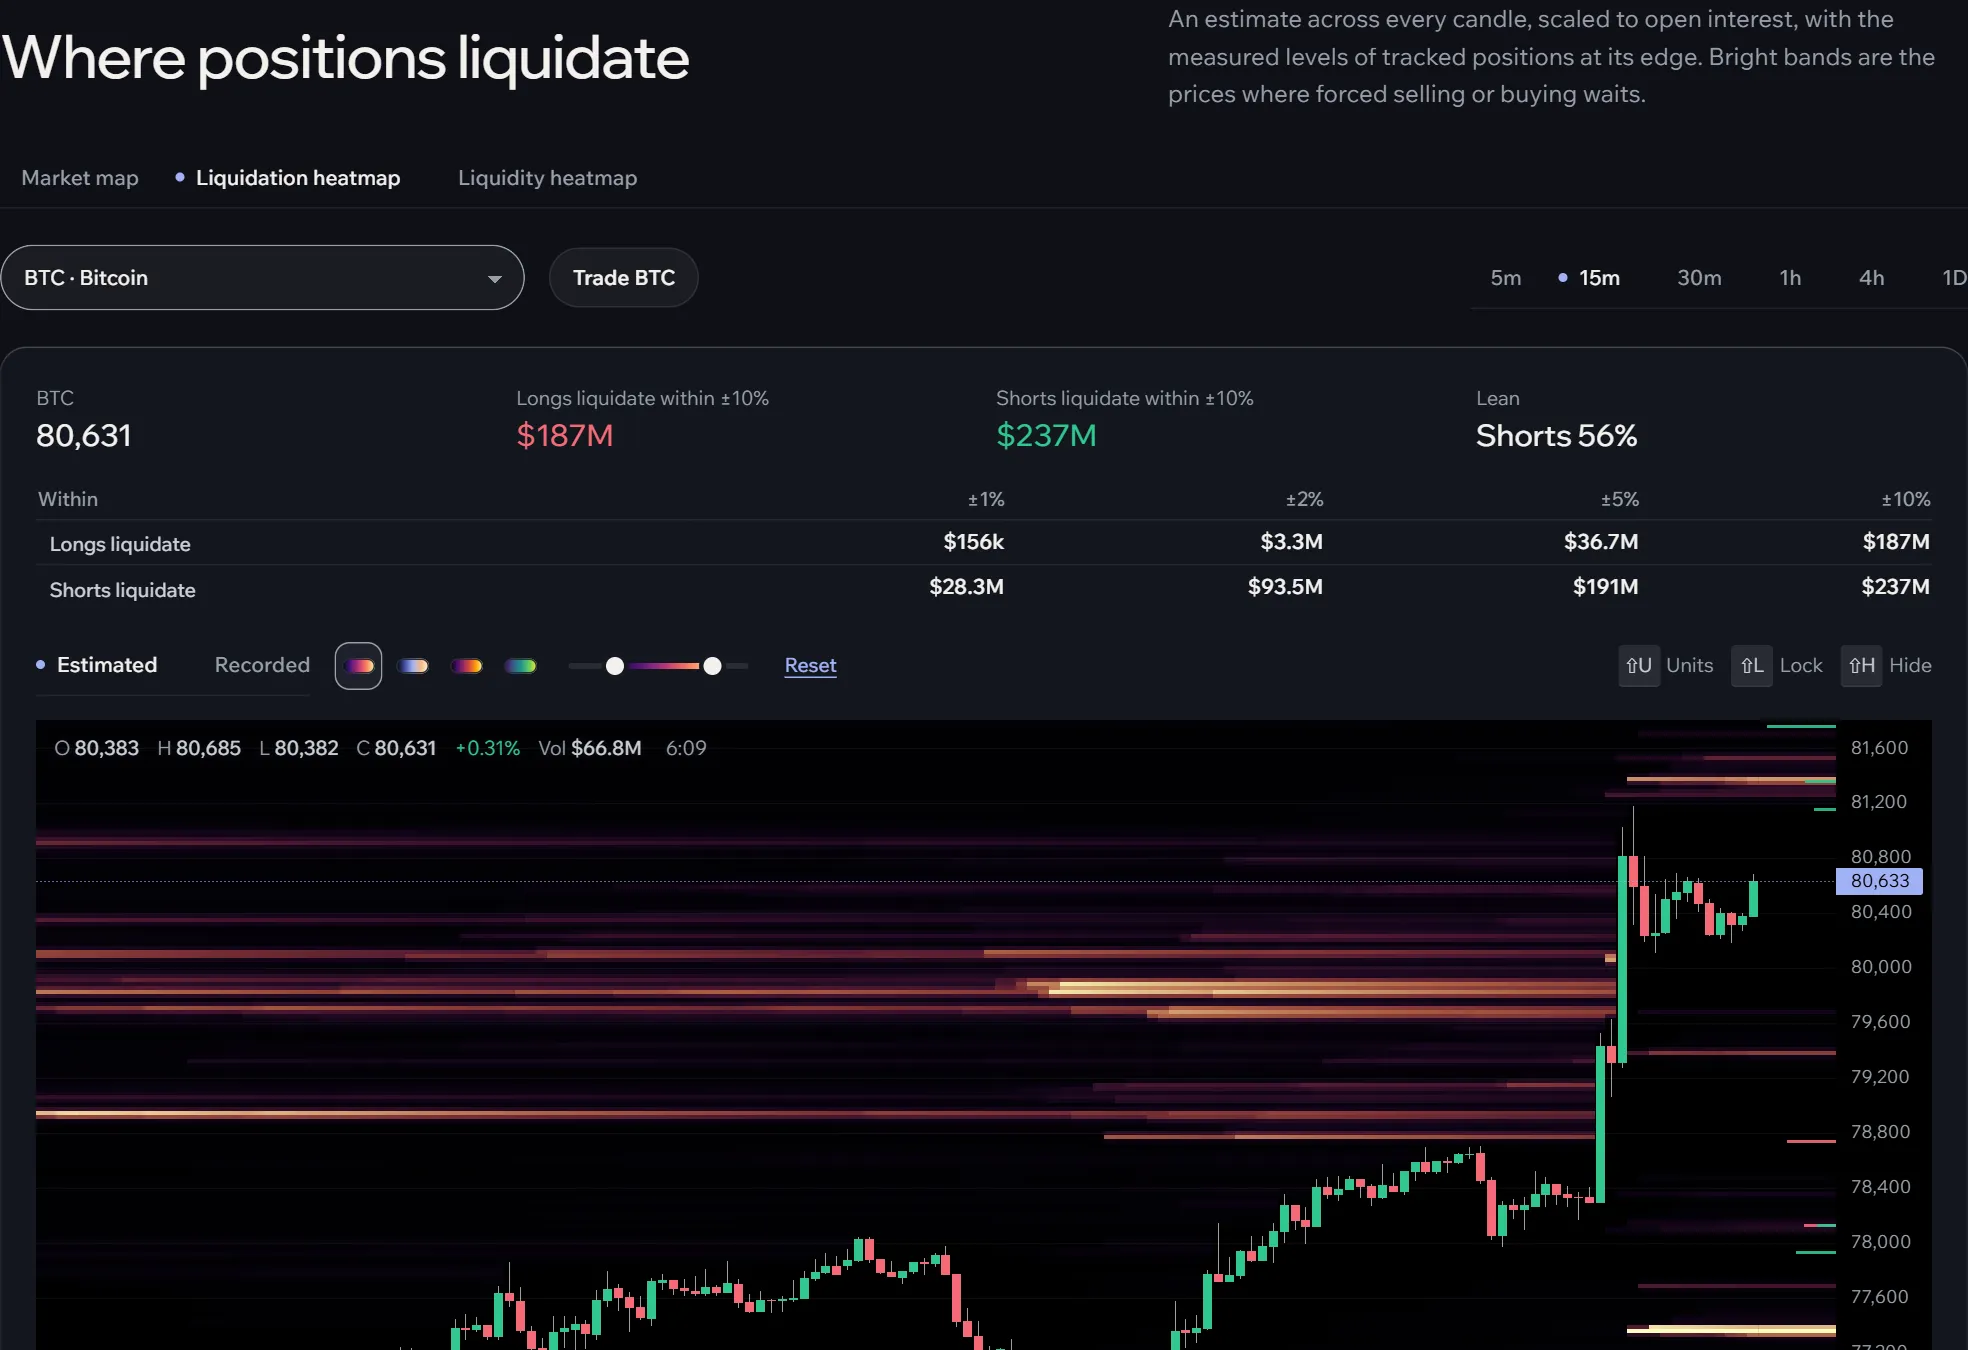
Where positions would be liquidated, drawn as cells behind the market’s candles: longs below the price in one colour, shorts above in the other, brighter where more would go. Two sources:
- Estimated: modelled from every candle, the leverage people use and the market’s open interest. It covers any market and any time.
- Recorded: the measured liquidation prices of the positions Afterbell tracks, as they stood over time.
Beside the chart: how the liquidations lean, how far they reach and how much sits within range, and the largest levels each side of the price.
The liquidity heatmap
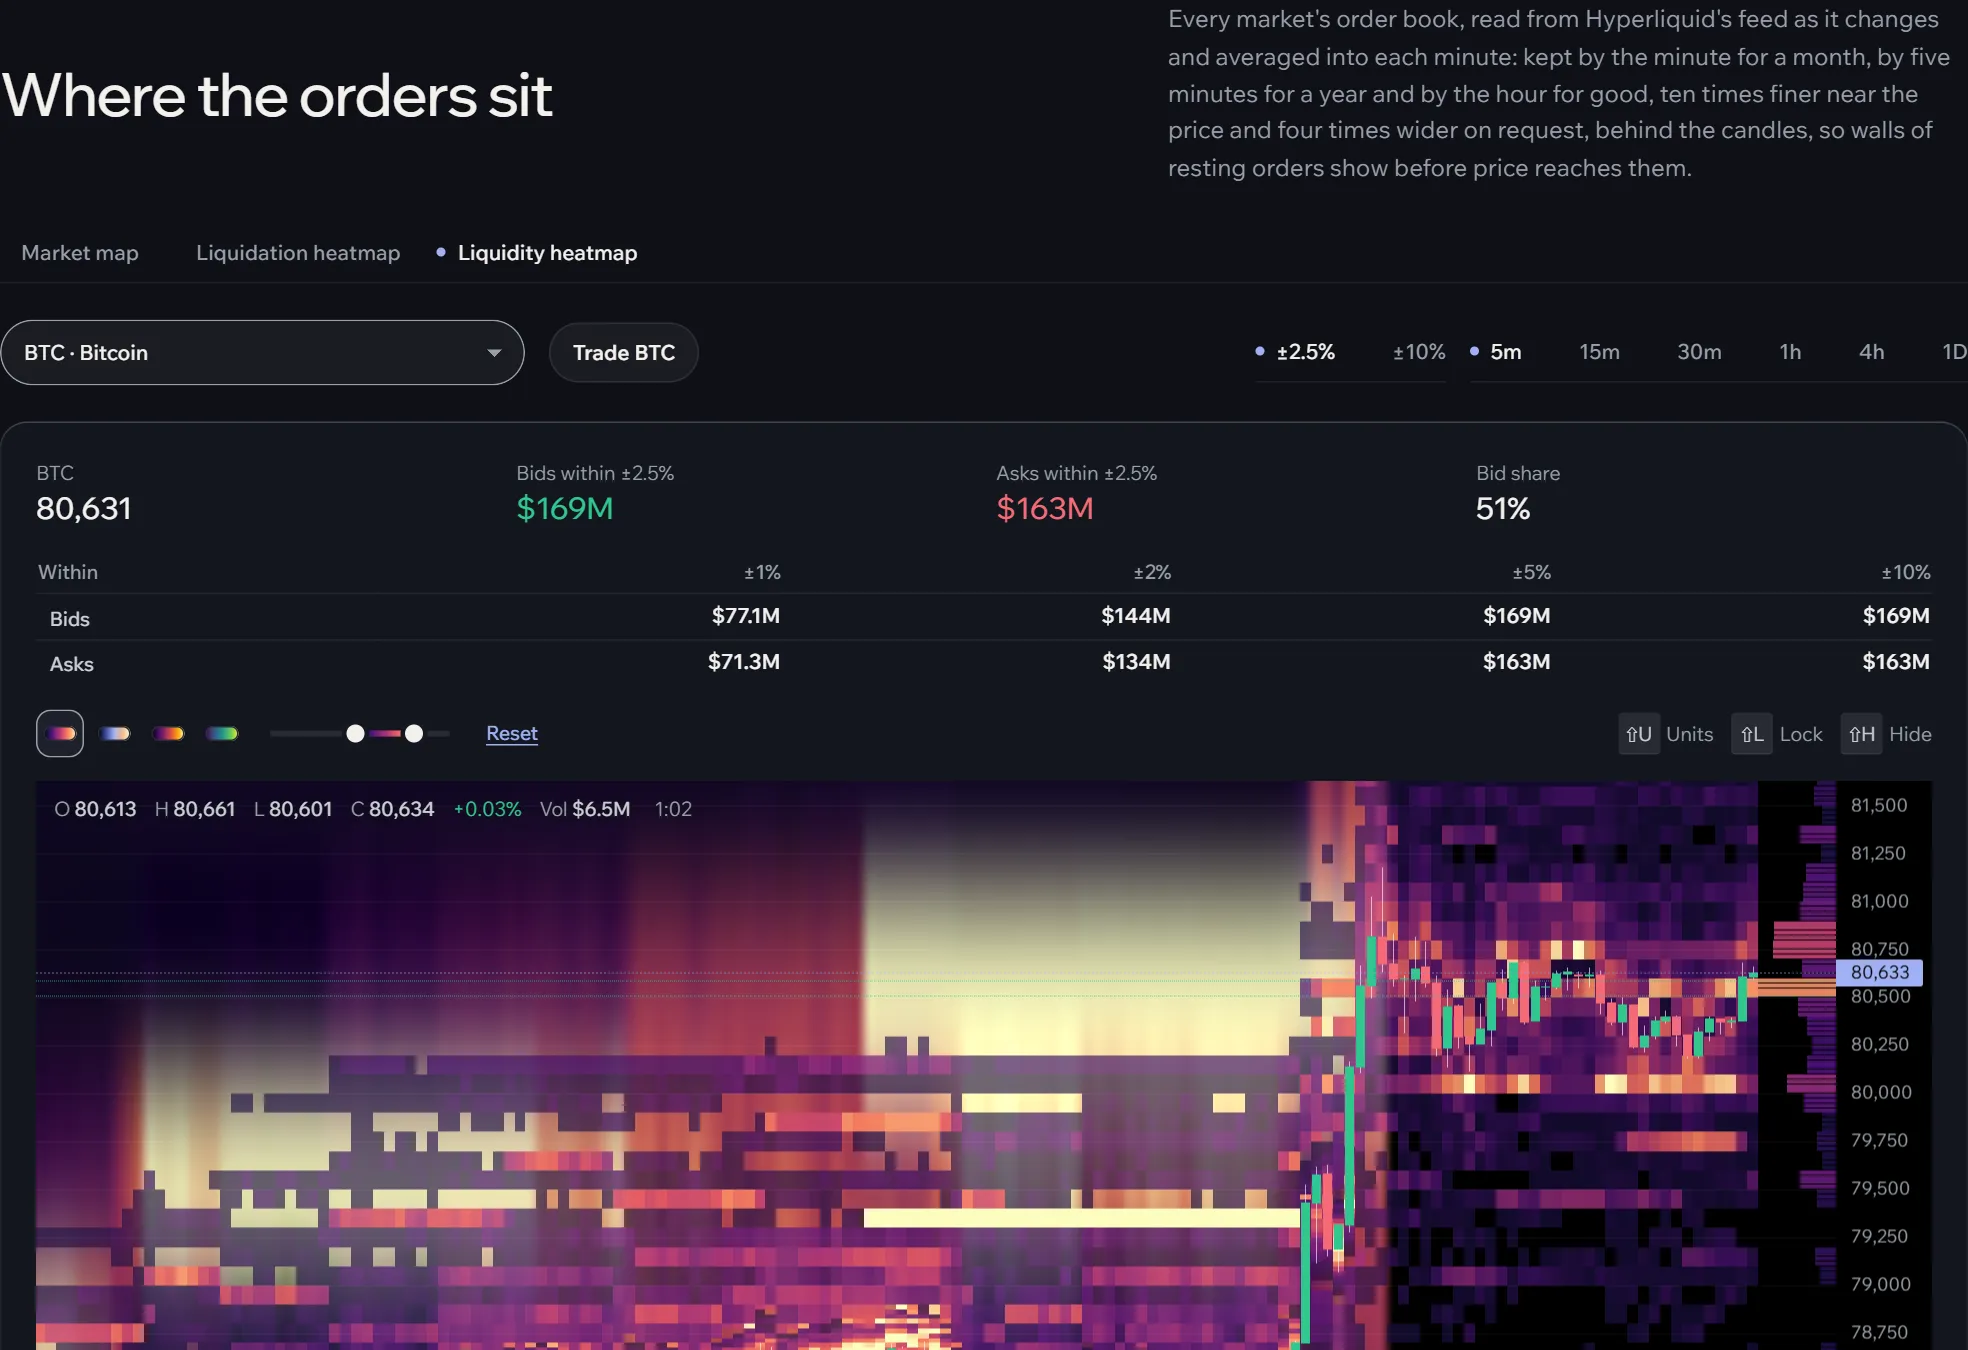
Where resting orders sit: Hyperliquid’s order book, recorded around the clock, kept by the minute for a month and by the hour for good. Bright bands are large orders; a band that stays for hours is a wall, and one that vanishes each time the price comes near may never have been meant to fill. The tables list the largest bids and asks now, and the bid share says which side is heavier.
Reading the cells
- Pick the market and the candle size; the heat follows the chart.
- Drag the two handles under the chart: the lower hides faint cells, the upper sets where colour is full. Pick a colour ramp beside it.
- Hover a cell for the inspector: the cells around the pointer with their values. Shift+U switches dollars and units, Shift+L locks it in place and Shift+H hides it.
Both heatmaps also draw on the terminal’s own chart: H for the liquidation heat, or the switches among the chart tools.