Docs Trade
The chart
Candles with the home market's sessions behind them, indicators, drawings, a second market to compare, and both heatmaps.
Candles from Hyperliquid’s live market, with the home market’s regular sessions painted behind them, so you can see at a glance what traded while the exchange was open and what traded while it slept. A line marks the last close.
Time and style
- Candle size: 1 minute to 1 week. A day’s chart opens on three years; scroll left for older bars.
- Style: candles, Heikin-Ashi (each bar averaged with the one before, so a trend reads as one colour) or a line.
- Scale: linear, log, or percent from the first visible bar. Volume bars switch on and off.
- Snap makes the crosshair stick to the candles.
Indicators
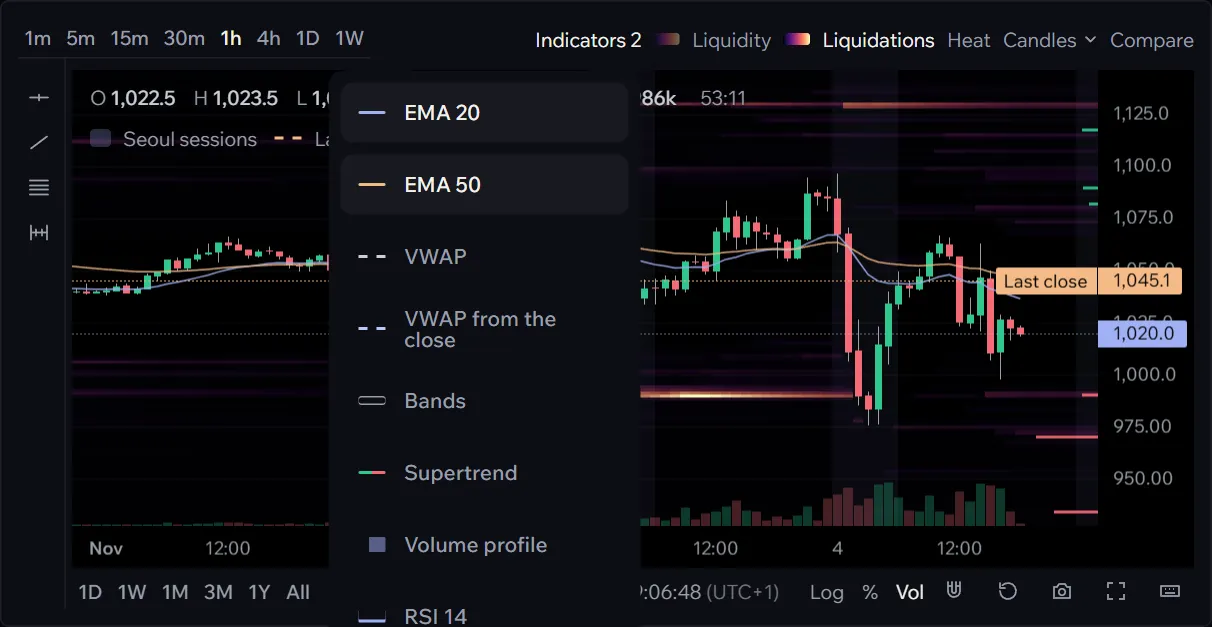
From the chart’s key: EMA 20 and EMA 50, VWAP, VWAP from the home market’s close (where buyers since the bell stand on average), Bollinger bands, Supertrend, a volume profile, and RSI 14 or MACD in a pane under the candles, one at a time. The choice is remembered.
Drawing
The drawing tools place a level (one price), a trend line, a Fibonacci retracement (click the swing’s low, then its high) or a measure. Drawings are kept per market in this browser; each has its own remove, and Your drawings lists them.
Compare
Compare draws a second market over the candles as a line, both on the same percent scale. SK hynix against Samsung, NVIDIA against the US tech index, a stock against Bitcoin: who led and who followed.
Heatmaps on the chart
The liquidation heatmap (H) and the liquidity heatmap draw behind the candles of every market, free. Heat levels sets how faint a cell may be and where colour is full. Hover a cell for the inspector; Shift+U switches dollars and units, Shift+L locks it and Shift+H hides it (Heatmaps).
Your trades on the chart
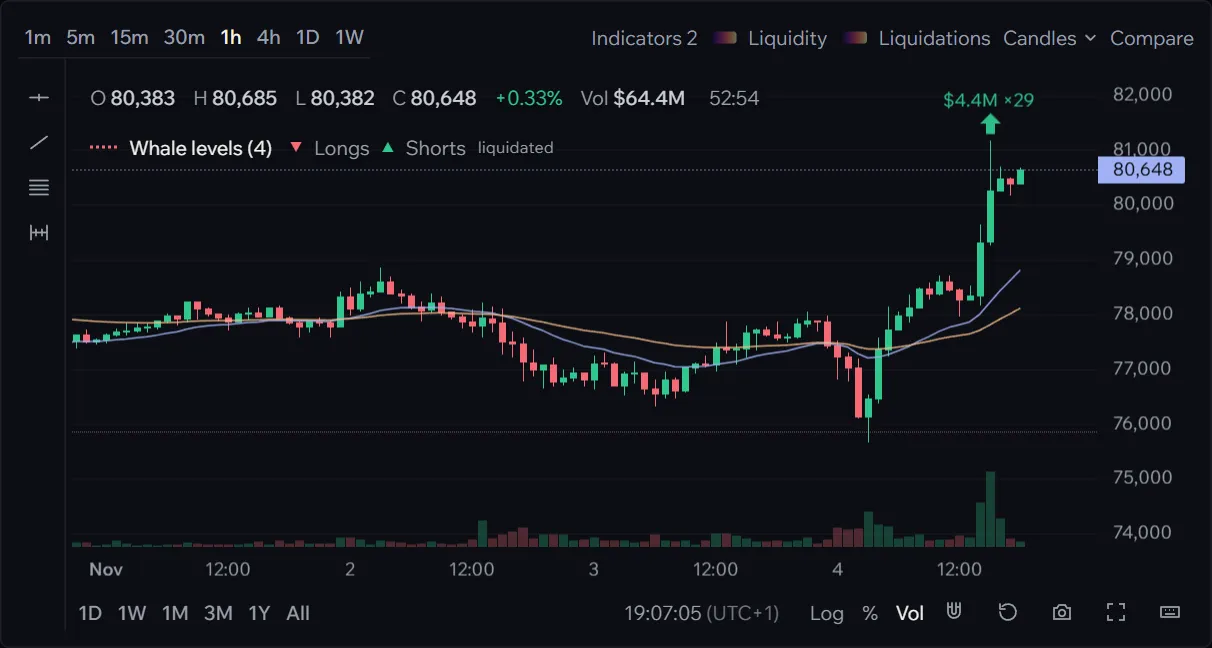
Your position draws itself: the entry, the liquidation price, the take-profit and the stop, and every resting order. When the liquidation price is beyond the prices on screen, a tag pins it to the chart’s edge. Recent macro releases and earnings reports are marked on the time axis.
Each level you draw lists two buttons under Your drawings: Alert, for a price alert there, and Limit here, which makes it the ticket’s limit price.