Docs Guides
Read the liquidation heatmap
Where the crowded stops sit, before you put yours there.
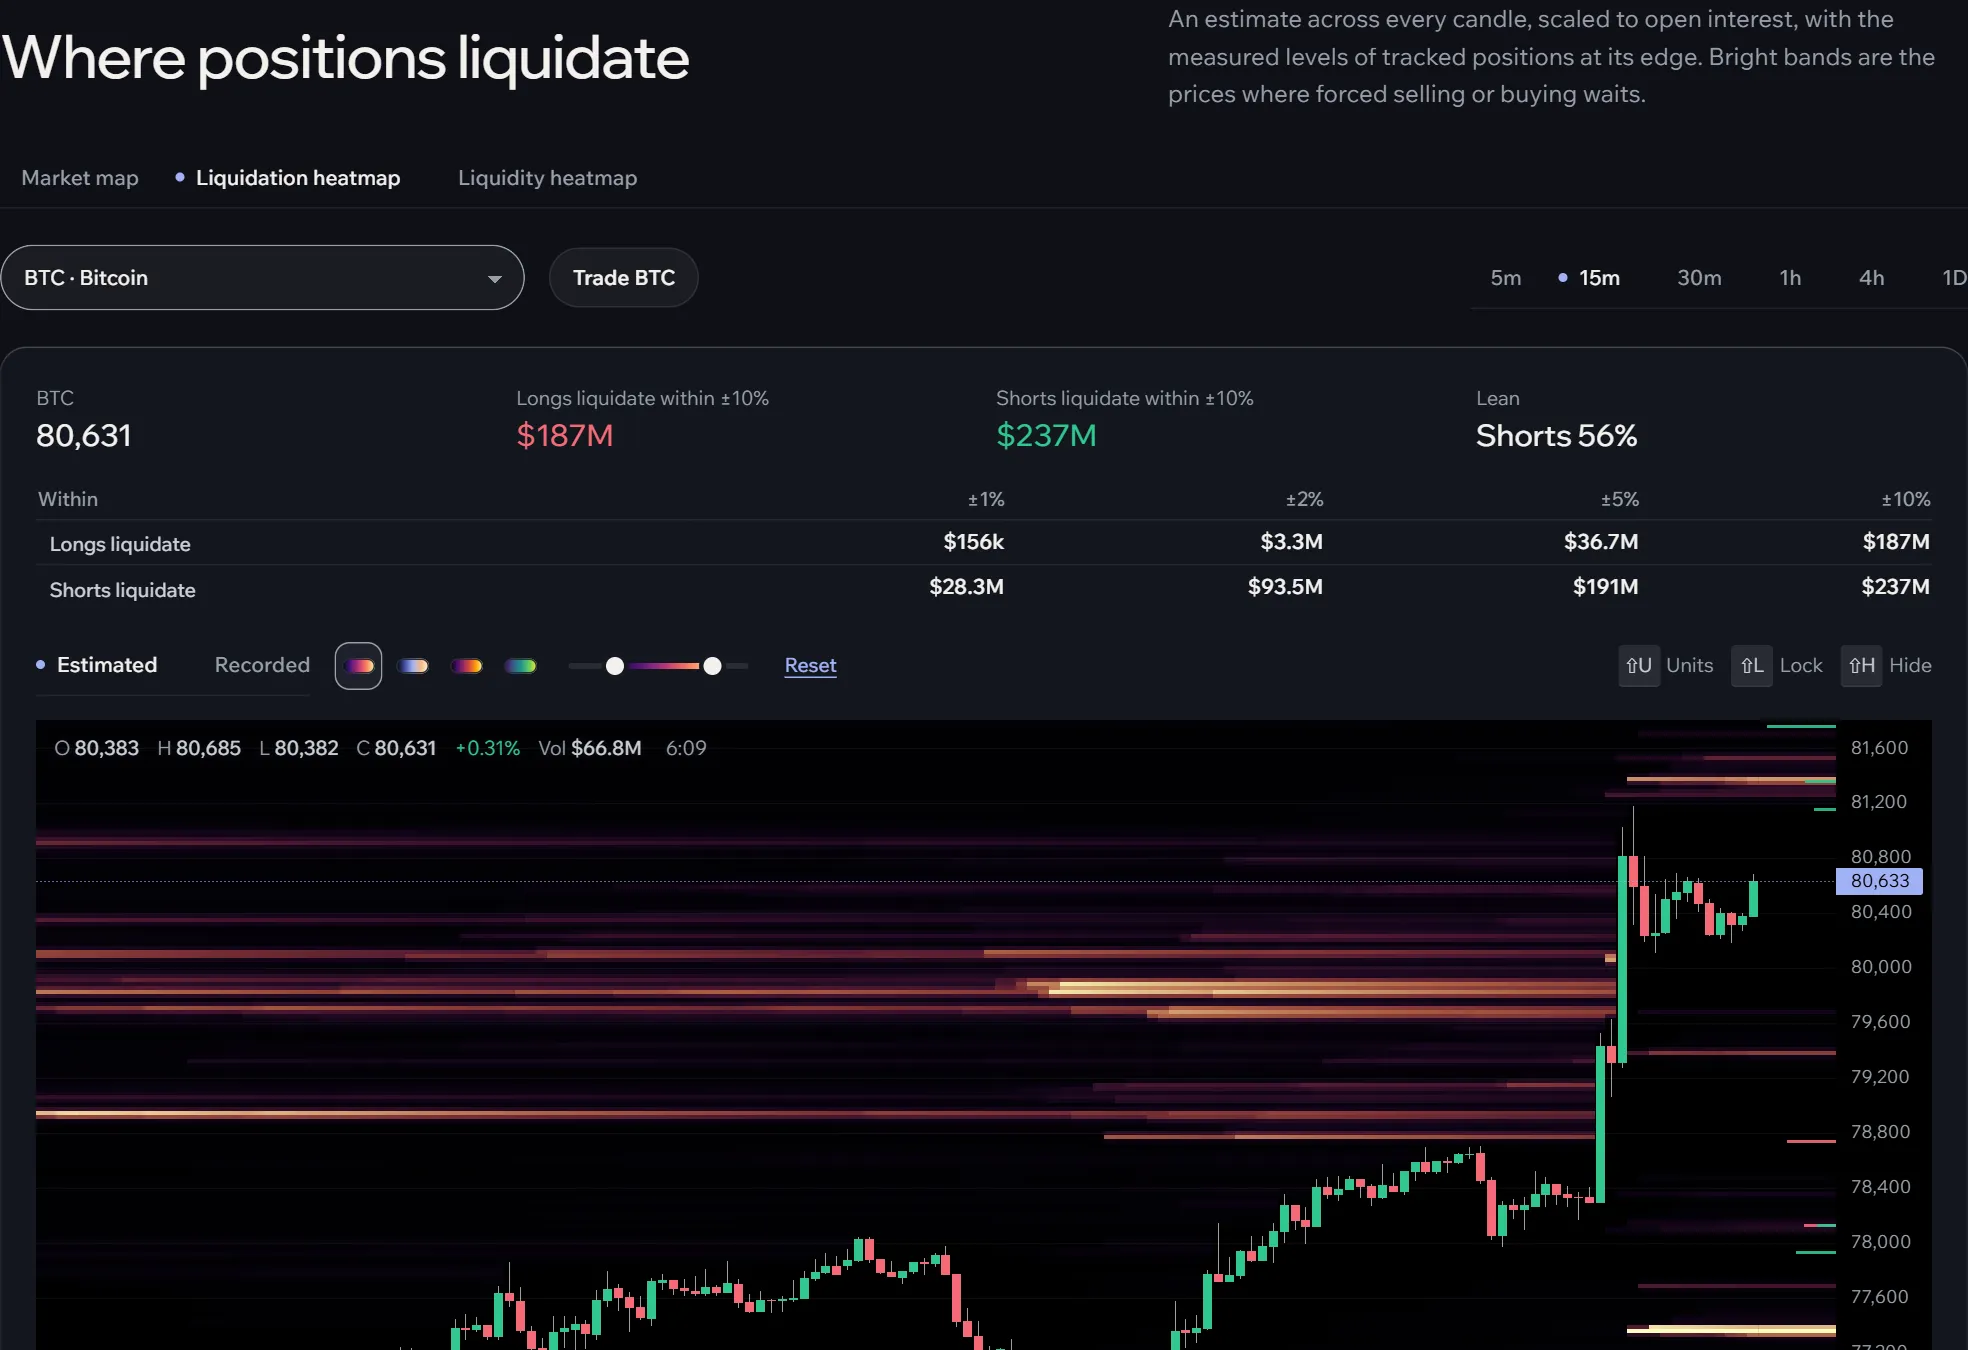
Liquidations cluster where many traders chose the same leverage at the same entry. When the price reaches a cluster, forced selling (or buying) feeds the move. Reading where they sit tells you where a move may speed up, and where not to put a stop.
- Open the liquidation heatmap and pick the market and candle size.
- Long liquidations sit below the price, shorts above. Brighter cells hold more.
- Read the totals beside the chart: which side the liquidations lean to, how far they reach, how much sits within range.
- Hover the brightest band for the inspector; Shift+U shows dollars or units, Shift+L locks it while you look.
- Switch Estimated to Recorded to see the measured levels of tracked positions over time.
In the terminal, H draws the same heat behind the chart you trade on.